


Console API is one of the most commonly used tools for debugging, offering much more than just simple log methods. Please bear in mind that you shouldn’t use Console API in most cases in production code. It may be helpful if you need to debug production code, but such methods shouldn’t live in production code for a long time. Instead, you should configure a proper logger for logs and a few other workarounds if you need functionality similar to what the console offers.
I will add a usefulness* score to each option I’m describing. Please remember that this is just my opinion, and you are free to disagree with this approach. It represents the flow of debugging I’m used to. The second thing I’m adding to those descriptions is linked to specific situations for which I find the particular functionality especially useful. Presenting a concrete use case for everything is hardly possible, but I always found such notes valuable. I often come across some excellent shortcuts for debugging. Still, there are many cases where, even if functionality seems to work perfectly, I can’t think of a place to apply it, and that is the gap I will try to fill with this article. If you want to read the unopinionated version of those functionalities, feel free to skip to the bottom of the article to the “Read more” section and follow those links.
Console API
This section is the part of the Console functionality that you can use in scripts, most browsers, even those quite outdated and even node.js (some may require –inspect flag to work). Unless you can execute JS in your mind, those should be the bread and butter of your daily work.
Logs
Usefulness* 10/10
This is a group of console methods explicitly used for logging; the group consists of:
- console.debug
- console.info
- console.log
- console.warn
- console.error
The above order is good to keep in mind since it corresponds to filtering options we can later perform on those logs. Log level order is:
- Verbose – every log
- Info – everything but debug logs
- Warning – warning and error logs
- Error – only error logs
There is another significant difference between those methods other than log level, console.warn and console.error will contain stack traces and have a different colour to spot them easier.
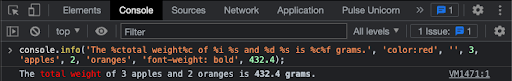
If you look closer at the documentation of those methods, you may notice that you can pass any number of arguments to those functions. This means you can use just one call to output multiple things. But there is also a secondary usage for multiple arguments – you can use format specifiers to append values to the string or even style it. I don’t consider it helpful in debugging, but if you are coming from another programming language using a similar convention, you may find this easier to use. Also, remember that this is one of those places where the behaviour/support between browsers/engines/environments can vary widely.
| Specifier | Purpose |
| %d | Formats the value as a string |
| %i or %d | Formats the value as an integer |
| %f | Formats the value as a floating point value |
| %o | Formats the value as a “optimally useful formatting”, Chrome uses it to pretty print expandable DOM element |
| %O | Formats the value as a JavaScript object |
| %c | Applies CSS style rules to the output string as specified by the next parameter |
I tend to use only three log methods – console.log for most cases and console.warn or console.error when I need stack trace, depending on which colour will be easier to find in the console at a given time (if I have many errors, a yellow warn may be easier to find).
Trace
Usefulness* 9/10
console.trace() is a valuable tool when you want just the stack trace and don’t care about logs. It logs a stack trace with log-level info. It’s the same trace you would get while using console.warn or console.error. It is also useful when you are actively debugging the code and want to print a stack trace so that you can get back to it later since if you move further with the debugger, the stack trace panel in dev tools will be updated with your current position.
Count
Usefulness* 10/10
console.count(‘label’) is another great tool but a bit tricky. It counts the number of its calls per given label, and I strongly suggest always using some label. I use React a lot, and in that context, it’s useful to count component re-renders which can also be done by React dev tools. But one thing you can use it for that React dev tools don’t cover (at least at the time of writing) is to count the execution of React hooks.
Now for the tricky part of using console.count(‘label’) – it is global. Unless you reset the count with console.countReset(‘label’) the count will be kept until you refresh the page or, in the case of node.js application – until you restart it. Moreover, specifically for counting React hooks execution, make sure that the component you are testing is attached only once or add some guard to the console.count() execution to make sure you are counting the execution of only one instance of the component. Suppose you don’t have an easy way to have only one component. In that case, you can add a new property to the component, apply it to the specific instance you want to test and then add if to check for that particular property value before calling console.count().
Clear
Usefulness* 10/10
console.clear(), as you may suspect, clears the console, nothing less, nothing more. Most browser dev tools also have a button for that. Worth noting is that at least in the Chrome console.clear() is disabled if the Preserve Log option is enabled.
Timestamp
Usefulness* 8/10
console.timeStamp(‘label’) lets you add a marker to the browser’s performance profiling tool. This can help to correlate a point in your code with everything else that is going on on the performance timeline. This method has not been standardised, so keep in mind that implementation may vary between browsers and on node.js you need to start node.js with –inspect for this method to work.
Time
Usefulness* 5/10
console.time(‘label’) is used to measure the execution time of the code between console.time and console.timeEnd . There are multiple ways of measuring the execution time of code, and this is one of the simplest. Just bear in mind that it is likely also the most expensive computing side, so use it for debugging only! In most cases profiling the code or using Performance API will be more useful.
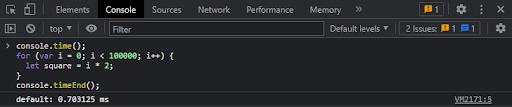
You can also use console.timeLog(‘label’) to log the timer’s current value without stopping it.
Group
Usefulness* 2/10
I like the idea of console.group(‘label’) but I never found a good use case. Let me first give you an example of how it may look like:
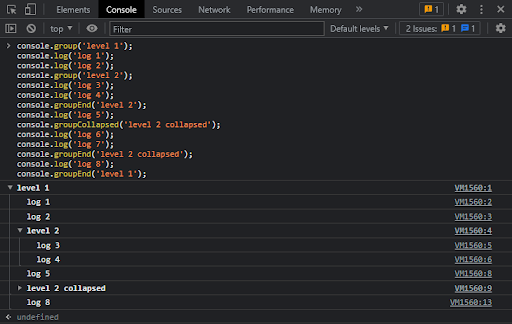
You can use console.group() or console.groupCollapsed() to group log messages. My first issue with grouping the logs is more of a world view of mine – when I’m debugging, I don’t care about looks. I need to find the faulty line, fix it and remove logs. Unless you need to show your debugging logic to someone else and you have an excellent case to group some logs, I don’t see any use case for it.
My second gripe with console.group() is that it’s tough to work with. Similar to console.count() grouping is also global, and if you combine it with asynchronous execution, it’s tough to group logs how you would want. Don’t get me wrong. I’m not criticising the implementation of grouping. I just don’t see any good way of doing it easily. Let me give you an example of where grouping would be excellent, in my opinion – the execution is impossible: Assume you have a React component that you want to test and want to encompass all of the logs originating from it in one group from mounting it to unmounting it. The first issue you will encounter is that it will gobble up any other logs into the component log group. The second issue is that if you have more than one instance of that component, the log groups will start mixing, and you will end up with one tremendous mess.
Assert
Usefulness* 7/10
I always forget that console.assert(Boolean) is a thing 😅. It logs comments only when the condition fails, like a shortcut of wrapping console.error with an if statement.

Dir
Usefulness* 2/10
console.dir(node) prints a JSON representation of the given HTML object. I never used it while debugging. The printed object is quite big so I won’t provide an image for it, but if you want to try it, you can check out console.dir(document.head).
Dirxml
Usefulness* 2/10
console.dirxml(node) prints an XML representation of children of the given HTML object. Like the previous one, I never used it while debugging, at least not directly. If you call code returning HTML objects in the console, you will end up with the same result, so calling console.dirxml(document) in the console is (at least in Chrome) equivalent to calling document.
Profile
Usefulness* 8/10
console.profile(‘label’) starts a profiling session with a given, optional label. To stop the profiling session, use console.profileEnd(‘label’) with the same label. You can have multiple profiling sessions running at the same time if you give them different labels, they can even be nested. While profiling the whole page is better to pinpoint the performance issues using console profiling, you can precisely profile just the parts of code you want to study further. If you want to use it with node.js, remember that it will only work when node.js is called with –inspect flag.
Table
Usefulness* 3/10
Many people like console.table(Array, [columns]). I prefer the object output, which is the only reason behind my usefulness score. This method accepts both arrays and objects, but key-value objects work best when it comes to objects. The second parameter can be used to control which fields should be displayed. Let me show you an example usage along with creating a quick summary of the Console API methods:

Console Utilities API
This is the second part of things we use in dev tools, but those are not usable in scripts! I will focus on utilities working in Chrome since this is my first choice for debugging, and at the time of writing Chrome is still the most popular browser. Some of those features will still work in other browsers, but some will be missing; for example, undebug, monitor and unmonitor are missing on Safari. On Firefox, about half of the features described below won’t work.
First, there are a few utilities that are just aliases for Console API methods, and I will list them below to get them out of the way:
- clear = console.clear
- dir = console.dir
- dirxml = console.dirxml
- profile = console.profile
- profileEnd = console.profileEnd
- table = console.table
$_
Usefulness* 2/10
$_ returns the value of the most recently evaluated expression. It may be just me, but I rarely remember the last expression I tried in the console. I usually repeat it with just an arrow up and re-executing the whole expression.
$0 – $4
Usefulness* 9/10
$0, $1, $2, $3, and $4 commands are a bit similar to _$ as they also provide historical reference of values, but they are not the console values but rather Elements panel selections or JavaScript heap objects selected in the Profiles panel. I tend to use only $0 and only with the Elements panel. The option to quickly select an HTML node in the Elements panel and get it in the console by just typing $0 can be advantageous.
$(selector) and $$(selector)
Usefulness* 7/10
$(selector) is a shortcut for document.querySelector(), analogically $$(selector) is a shortcut for document.querySelectorAll() . It’s a notation that jQuery made so popular that browsers adopted it as a built-in utility.
debug/undebug
Usefulness* 9/10
debug(function) is a utility to insert a breakpoint when a given function is executed. Since it can only be used in dev tools, you won’t be able to put it in a script, but you can use a debugger statement there instead. This can be a lifesaver when you are debugging a minified code. There are some instances where putting a breakpoint in an un-minified code puts it in the wrong spot, and in those instances, debug(function) always worked for me. Another good use case is also in minified code when you have a named function passed somewhere, and you want to debug it without looking for its declaration. You can use undebug(function) to remove the breakpoint. Alternatively, you can just refresh the page, as it will not persist.
monitor/unmonitor
Usefulness* 8/10
monitor(functions) adds a logpoint to the function execution. Upon execution, the console will get a log message with the function name and the arguments it was called with. It’s similar to debug(function), and useful in the same situations but not as powerful as stopping execution. You can use unmonitor(function) to remove the logpoint or refresh the page.
copy
Usefulness* 10/10
copy(object) copies given objects string representation to clipboard. This was a game-changer for me. This is the best use if you need to copy a large object from the console. At some point, Chrome added a Copy object to the context menu if you right-click on an object in the dev console, so you can use that instead, but knowing about this function’s existence can save you some time. I hope you will never again have to try selecting a large string in the dev console just to realise that, at some point, it’s truncated.
inspect
Usefulness* 3/10
inspect(object/function) opens the appropriate panel in dev tools and selects the specified element. It’s kind of the opposite of $0 – $4 utilities. For example, calling inspect(document.body) will open the Elements panel and select the body tag. It’s the same as calling the Reveal in Elements panel in the context menu when right-clicking on an object in the console. Usually, you are debugging the opposite way, it rarely happens that you have an HTML object in the console and need to find it in the Elements panel, but then you can use this utility.
getEventListeneres
Usefulness* 7/10
getEventListeners(object) returns the event listeners attached to a given object. The return value will be an object with keys representing the various event types. You can use it with a combination of functions I described earlier to get into various event listeners, example: select a button element in Elements panel and then type debug(getEventListeners($0).click[0].listener) in the dev console to get a breakpoint in that listener function.
monitorEvents/unmonitorEvents
Usefulness* 2/10
monitorEvents(object [events]) logs Event object to the console when one of the specified events is triggered. Example usage: monitorEvents(window, “resize”) . I never found a good use case where this utility was too helpful. Usually, if you are listening for some event, you have an event listener attached to it, so you can use it to log/debug the listener function. Just listening without actually attaching the listener may be useful if you are exploring if a given event is good for you to use, but otherwise, attaching the function will work better.
keys/values
Usefulness* 1/10
keys(object) and values(object) utilities are aliases for Object.keys(object) and Object.values(object), useful, but if you are anything like me, then you will never remember they are there and will just use the method from Object instead.
queryObjects
Usefulness* 5/10
queryObjects(Constructor) returns a list of objects created with the specified constructor. If your code relies heavily on classes, this may be a nice tool for you. You can test it by executing queryObjects(Promise) which will return all instances of Promise initialised in this session.
*This is my personal view. Feel free to disagree!
Read more:
- https://developer.chrome.com/docs/devtools/console/api/
- https://developer.mozilla.org/en-US/docs/Web/API/Console
- https://developer.chrome.com/docs/devtools/console/utilities/